31 Ağustos 2015 Pazartesi
A good paper, with a sad title.
Son-of-a-fish....
I have to show this one to you guys. Despite some great new advances recently, we really still do lag behind a lot of other biological fields when it comes to statistics. It is getting better all the time, especially with new bioinformaticians coming from other fields into ours. We'll have it all down soon and I'm excited for all the advances that keep coming.
In terms of bioinformatics, we have two studies out there that have some pretty big targets painted on them. These studies are our first 2 drafts of the human proteomes. They are awesome studies of remarkably high level sample prep, instrumentation and methodologies. However, both relied heavily on the statistics tools that we all use in our daily work. In data sets this large and complex, our typical tools, namely the 1% false discovery rate, seems particularly weak. 1% bad matches sounds pretty good until you have a billion observations.
The title of this paper is a good one: "Solution to Statistical Challenges in Proteomics Is More Statistics,Not Less." and really highlights the value of more, and increasingly robust, statistical analyses in our proteomics studies when we are looking at increasingly larger datasets.
It makes me sad (and I find it just a little scary) because I don't personally have the background to effectively evaluate the quality of the statistics. Now that we're in this era where our instruments generate more data than we could ever possibly manually examine we are going to need to rely more and more on these algorithms to sort things out and we're going to have to find a way to let go of a little control and trust them.
This paper is a good, short, open access(!) read.
30 Ağustos 2015 Pazar
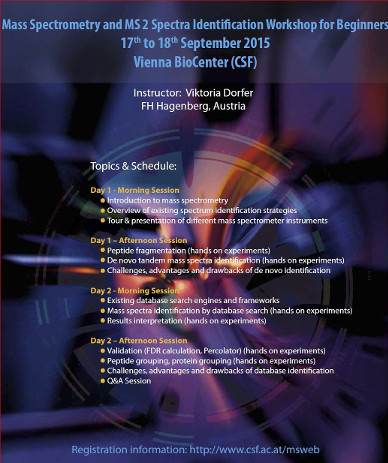
New to mass spec base proteomics? Check out this workshop in Vienna!
Umm...so...if you are desperately searching for a way to learn mass spectrometry
29 Ağustos 2015 Cumartesi
Proteomics + transcriptomics to find circulating signatures of aging
Aging sucks. You spend all this time looking forward to it when you're a puppy. Looking toward the day when you can drive and stay out all night dancing and are trusted to go outside and do your business and come back inside when you're done. But then it should stop. And progress is being made here and there on that front, but before we can stop it we need to understand it a little better. There are tons of good papers out there studying aging in mice and worms and zebra fish. Its tougher to do this stuff with human beings.
For an interesting model of how we could analyze human aging check this paper from Christina Menni et al.,(open access!). It isn't my typical proteomics paper but there is a lot of interesting stuff here.
First of all, they have a big group of human female twins, called the TwinsUK cohort. Twins are great for studying all sorts of things, but are most often called upon for nature vs. nurture type studies. Another awesome use of twins? Biological replicates! What they did here was take plasma from this large group of British ladies and performed standardized RNA-Seq analysis looking for changes that could be aging related.
Another great thing about studies of this kind is that once you get a bunch of human volunteers lots of researchers want to test lots of different technologies on their samples. Turns out that most of these volunteers had already had plasma drawn and ran through a kind of protein array technology called SOMAScan (you can read about it here if you are interested!)
What did they find? Clear, circulating biomarkers that are detectable at the RNA level and carry over to the protein. When you go for overlaps of technologies between RNA and protein you are going to typically see a pretty small list, and this study is no exception, but they found a cool little list.
28 Ağustos 2015 Cuma
Finally! One report for global and phosphoproteomics data!
As I mentioned in an earlier post, I've been working on a lot of things, but I haven't been finding a huge amount of success lately. I'd like to reverse that right now with maybe my favorite study I've ever set up.
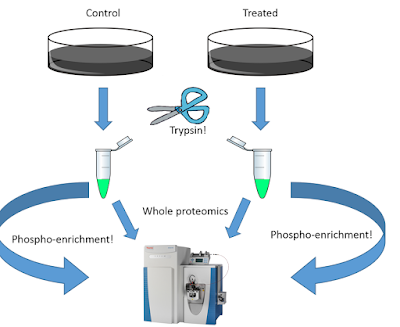
Above, I made a quick PPT drawing for what I consider a typical simple phosphoproteomics experiment. Control cell line vs. treated cell line. Digest out the peptides. Run some of the peptides for global proteomics and enrich the rest for phosphoproteomics. Run it all on the same awesome high resolution instrumnet. Shouldn't you end up with data like this?
Okay, so what are we looking at here? This is a slice of a screenshot from a Proteome Discoverer 2.0 multiconsensus report. On the right we have accession numbers for the protein of interest. In the middle we have the exact side of phosphorylation within the protein(!!eek!! this one still makes me really happy!!) but even better is what is in the right column. We have 4 columns. The first 2 are the total relative area of the PROTEIN from the whole proteomics samples. The next 2 are the relative quantification of that phosphopeptide!!!!
Are you as excited as I am? Okay. Probably not. But check this out. The first one? When we treat with this drug we get up-regulation of the phosphorylation at Serine 83 in this protein of about 3 fold. That could be actual upregulation of the protein itself because we never detected this protein in the whole protein sample. But check out the last one in the screenshot. Phosphorylation on threonine 399 in this protein is upregulated following drug treatment by 5.2 fold but if we look at the total quantification of the peptides found for that protein (it doesn't show it here, but there are 7 of them!) the protein doesn't really look up-regulated. We've found a drug specific phosphorylation event! And this is in one PD 2.0 report.
I can't tell you how much I wish these functions existed during my postdoc...there aren't words.
So, how do you do it? It isn't easy. It took me...several... tries to get it exactly right. So good luck!!
Wait, just kidding. Why don't you watch this video and I'll show you how I did it.
As always, watch it in HD (once its available!). P.S. This is even better to set up in PD 2.1, but we'll talk about that later!
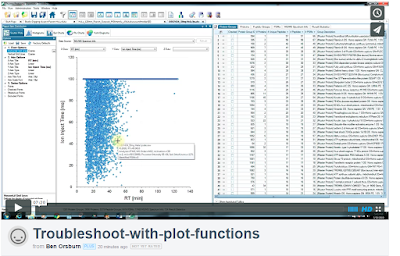
Troubleshoot your experiment with the plot functions in Proteome Discoverer 2.0
Remember RAW Meat? Man, I loved that program. Unfortunately it doesn't work for a lot of newer instruments. What if I told you that virtually every function in RAW meat is hidden in Proteome Discoverer 2.0?
They are. And they are under the plot functions.
You can plot your mass discrepancy (at PSM or peptide level), you can plot your ion injection times (for MS/MS scans or for PSMS and as a histogram or over time). You can get your charge distribution to see if that matches theoretical for your enzyme (2 or 3 for trypsin, etc.,), you can plot your missed cleavages and on and on.
Now. I picked a bad screenshot above. I can't seem to plot my TopN. Maybe I haven't found it yet. Or maybe I need to submit a feature request!
You can learn more about this here!
27 Ağustos 2015 Perşembe
Postdoc job opening at Edgewood
Hey! Are you pretty darned good at mass spec? Are you looking for a postdoc? Wanna run cutting edge instruments for super secret U.S. military projects? Want to hang out with me once in a while cause its my buddy's lab and he lets me pop in and run stuff when I'm in town?
Then you should check out this listing here on the ASMS website! Oh, and it pays nearly 3x what I made during my first postdoc..so you know...it that is something that matters to you then you have that too!
26 Ağustos 2015 Çarşamba
Kaydol:
Yorumlar (Atom)
Popular Posts
-
A recent paper in PNAS makes the statement in the title "Protein Carbamylation is a Hallmark of Aging. You can find it here . They find...


