14 Eylül 2015 Pazartesi

Proteome Discoverer 2.0 / 2.1 workshop in Vancouver!


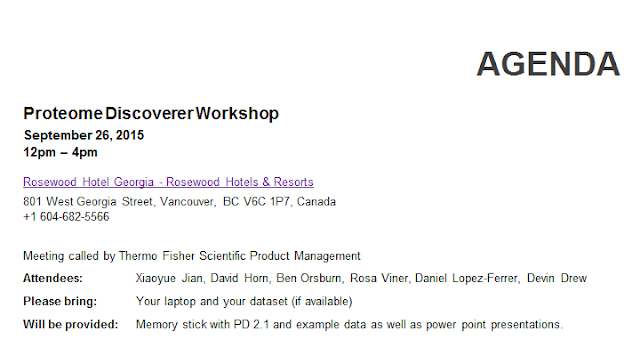
If you are going to beautiful Vancouver for International HUPO, you might want to pop by the Proteome Discoverer workshop where you'll get to see the introduction of this guy!
Wait? What? We just started using PD 2.0...are you crazy? Yes, but that's beside the point. PD 2.1 is a follow-up package that looks just like PD 2.0 but better. There were features and improvements that were recommended by all you users out there that just couldn't make the 2.0 cut.  Its so good that I pretty much just use PD 2.1 for everything.

Here are the details!!  This is meant to be interactive, not "DEATH BY POWERPOINT". Bring questions, data, whatever. This is great software and we want you to walk out of there with the ability to generate better data!

Here are the details I have right now. I'll add more info as I get it.


12 Eylül 2015 Cumartesi

The effect of peptides/protein filters.


We're a field that loves to count things! As we've matured as a field the numbers have been a great benchmark for us. And they keep getting bigger all the time. Better sample prep, better separation technologies and faster, more sensitive instrumentation is making it possible to generate data in hours what used to take days or weeks not all that long ago.  

In papers where we detail these new methodologies, we see one type of protein count filter, and I think we see something a little different when we look at the application of these technologies. If you want to show off how cool your new method is, when you count up the number of proteins you found you are going to go with 1 peptide per protein for certainty. In my past labs we recognized those methods as great advances, but I sure had better have at least 2 good peptides before I justified ordering an antibody!

 I don't mean to add to the controversy, by any means. I think using one peptide per protein can be perfectly valid. Heck, we have to trust our single peptide hits when we're doing something like phosphoproteomics! Cause there's just one of them. And if I'm sending my observations downstream for pathway analysis, I'm gonna keep every data point available.  I just wanted to point out how the data changes.

I downloaded a really nice dataset the other day. Its from this Max Planck paper and uses the rocket-fast QE HF. I picked one of the best runs from the paper and ran it through my generic Proteome Discoverer 2.x workflow.


In 2 hours I get about 87,000 MS/MS spectra. If I set my peptide-protein so that any single peptide means a protein with this setup I get 5,472 proteins from this run.

Now, if I apply the filter 2 peptides per protein minimum...


Ouch!  I lose over 1,200 proteins!  

Are they any good?


Okay, this is an extreme outlier, but this protein is annotated in Uniprot, so its a real protein and it only has one peptide!  This is 92% coverage!  I didn't know there were entries this short in there.  If we went 2 peptides/protein we'd never ever see this one.

The best metric here probably is looking at FDR at the protein level.  (I did it the lazy target decoy way 1% high confidence/ 5% medium confidence filter)


Its interesting. Of these 1,200 single hit proteins, about 150 of them are red (so...below 95% confidence). Another 150 or so are yellow, but the rest ~900 proteins are scored as high confidence at the protein level.

Okay. I kind of went off the rails a little. Really, what I wanted to take away from this is how very much using a 2 peptide count filter can affect your protein counts.  The difference between identifying 5400 proteins and 4200? Thats a big deal and worth keeping in mind. Is your data going to be more confident if you require this filter? Sure. Are you losing some good hits? Sure, but its your experiment and you should get the data out at the level of confidence that you want it!
pVIEW: tons of tools, including 15N (n15) quantification


I swear I wrote a blog post on this years ago. Seriously, but it took me forever to find this software and then re-remember how to use it.

pVIEW is a really nice piece of software. It does a ton of different things...including 15N quantification!

It is incredibly user-friendly. If you are using a Thermo Instrument, I highly recommend you download this tool as well:

Whats it do? Well, you click on it and show it a directory. And then, without complaining or without any extra steps it converts you data rapidly and perfectly to mZxmL (not sure I capitalized the right stuff.) Then you can pull your data right into pVIEW.

pVIEW can be downloaded at the Princeton Proteomics and Mass Spec core website here.


10 Eylül 2015 Perşembe

Run complete programs on any system with BioDocker! Wait...what's a BioDocker?


Okay. I'm going to be pretty excited about this whole thing, cause I knew about exactly none of this 20 minutes ago.

It is totally awesome that we have all these talented programmers and bioinformaticians out there writing interesting new code. A problem is that, just like any expert in anything, they start talking their expert-ese and it becomes hard for outsiders to figure out what they are talking about. I take things about proteomics -terms and such, for granted all the time even though I try very hard not to.

This is an acknowledged problem in their field. That they can't reach users cause sometimes users don't know what a Perl thingy is.  Even worse, maybe someone assumes that you have that Perl thing on your PC because they've had it on every PC they've owned in the last 15 years.

An awesome effort is underway and its called Docker. Its generic for everybody, but what I can understand of it is that its a "container" for a program that includes all the requirements for running it. Say you need that Perl thing and some Perl add-in things, then it would be included in the Docker.

A more focused thing for us is BioDocker. Same goal, but specifically for bioinformatics type stuff.  Sounds great, right?!?

BTW, I'm learning all this from Yasset's blog.
Cause you know what? They've already constructed two awesome proteomics BioDockers.  The first is the all-powerful Trans Proteomics Pipeline and the second is the DIA-Umpire!

Is it simple enough that a dummy like me can use it? Actually...I think it might be...not without challenges, but its getting there!

If it isn't 100% what we need/want right now, its a great step in the right direction. Lets get all these awesome tools and put them into an easily digestible format. They get more users which hopefully translates into more grant justifications and more cool algorithms and we get better data!  Win win win!

Video of Dr. Makarov talking about every Orbitrap!


I just stumbled on this video and its pretty sweet. Its Alexander Makarov talking about every Orbitrap -- from the classic all the way to the Lumos and the developments each one went through!  Worth the half-hour for me!

9 Eylül 2015 Çarşamba

Macrophage S1P Chemosensing -- and an interesting way of integrating genomics and proteomics!


All this next gen sequencing data out there!  How do we leverage all of it to our advantage? We can supplement our databases for mutations and we can cross-reference our quan, but this new paper from Nathan Manes et al., out of

In this new paper at MCP from Nathan Manes et al., out of the CNPU these researchers describe a different twist on integrating next gen sequencing data with LC-MS/MS.

The model is also super interesting. The study investigates osteoclasts, the cells that destroy bone. During normal maintenance osteoclasts break down bone where appropriate and osteoblasts rebuild it. This is a tightly controlled process (involving chemotaxis), but one that is only partially understood. Disregulation of this tight process leads to many different diseases, the most common of which is osteoporosis.

The focus of this study is the use of next gen sequencing technology and mass spec to explore that pathway. As a model they have some mouse cells that function like osteoclasts and they can add the right chemotaxic things to activate them. Cool, right?!?

First they started out with the next gen sequencing following all the normal protocols (they did deep sequencing via Hi-Seq) to get a list of transcripts that were differentially regulated in a significant matter.

Then they went a different direction. They used an in-depth literature search to hunt down proteins that have been implicated in these pathways. Some of this info comes from other quantitative proteomics studies and others come from genomics techniques. Why reproduce data that is already out there for free!  Strong protein candidates were filtered and heavy copies of good peptides were made to develop an absolute quantification method for SRM analysis for these targets.

To wrap it all up they took the results from their next-gen and from their absolute LC-MS quan and compared it (it compares strikingly well!) and then they dumped it all into a cool modeling program called Simmune that they developed that you can check out (and download for free) here!

Great, interesting study on an interesting model that uses some really original thinking and tools.

7 Eylül 2015 Pazartesi

File migration...


Hey guys!  The following pages through the blog are currently down but are finding their way to new, awesome, permanent homes:

The Orbitrap Methods database is down completely
The Exactive family cycle time calculators are still available (email me: orsburn@vt.edu and I'll get them to you). My PPT tutorials are also down.
They might be down for a few days. The migration isn't a simple drop and drag but these new solutions should allow the documents to be accessible to more people...permanently...and will be free for me!

All videos are still up...and also migrating to duplicate locations..w00t!